
Severe Convective Storms: On September 12, 2026, the Storm
On September 12, 2026, the Storm Prediction Center's 0100 UTC Day 1 Convective Outlook placed a Slight Risk — category 2 of 5 — across portions of the
On September 12, 2026, the Storm Prediction Center's 0100 UTC Day 1 Convective Outlook placed a Slight Risk — category 2 of 5 — across portions of the central United States. That designation sounds modest. It is not. A Slight Risk day produces roughly 40% of all significant tornadoes in the SPC's historical database, precisely because it describes an atmosphere that is loaded but not yet committed.
Understanding what "loaded" means requires two numbers: CAPE and shear.
The Two Ingredients That Actually Matter
CAPE — Convective Available Potential Energy — measures how much energy a rising air parcel can extract from its environment before it runs out of buoyancy. The unit is joules per kilogram. A CAPE of 500 J/kg is enough to support ordinary thunderstorms. Values above 2,500 J/kg describe an atmosphere that is effectively a compressed spring: any trigger — a frontal boundary, a sea-breeze confluence, a subtle shortwave trough — can release it violently.
Wind shear is the change in wind speed or direction with altitude. It is what separates a pulse thunderstorm, which rises, rains itself out, and collapses in under an hour, from a supercell, which can persist for six hours and track 200 miles. Specifically, 0-6 km bulk shear above roughly 40 knots tilts a storm's updraft away from its own precipitation. That tilt keeps the updraft from choking on its own rain and allows the storm to ingest warm, moist surface air continuously.
The combination — high CAPE, strong directional shear — is what the SPC's forecasters are reading when they draw a Slight or greater risk area. Neither ingredient alone is sufficient. The central plains in July can post 4,000 J/kg CAPE under weak shear and produce nothing but disorganized afternoon convection. The same region in April with 1,500 J/kg and 55 knots of bulk shear is a different problem entirely.
Why the United States Produces More Tornadoes Than the Rest of the World Combined
The geography is the answer. The Rocky Mountains force the polar jet stream into a southward dip over the western United States, then allow it to accelerate northeast — a configuration that routinely drives cold, dry air eastward at 500 mb while warm, humid air from the Gulf of Mexico streams northward at the surface. The result is a vertical stack of air masses with radically different temperatures, moisture levels, and wind directions.
The dryline is where this collision is most visible. It is a moisture discontinuity — a boundary running roughly north-south through the Texas Panhandle and western Oklahoma on active spring days — where Gulf moisture ends and continental desert air begins. Dewpoints can drop 30°F in 50 miles across a dryline. Storms that fire along it have immediate access to that deep Gulf moisture on their eastern flank and the dry mid-level air that accelerates evaporative cooling and storm-relative inflow on their western flank.
When a supercell develops in this environment, the directional wind shear — southerly winds at the surface, westerly winds at 500 mb — imparts horizontal spin to the atmosphere. The updraft tilts that horizontal spin into the vertical, creating a rotating column called a mesocyclone. Doppler radar detects this as a couplet of inbound and outbound velocities. When the mesocyclone tightens and stretches toward the surface, the rotation accelerates by conservation of angular momentum — the same physics that pulls a spinning skater's arms inward. A tornado is the visible expression of that final contraction.
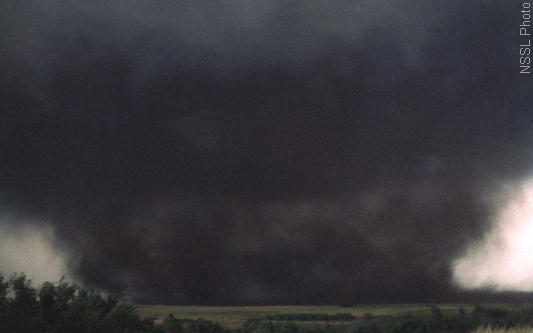 NOAA NSSL archive
NOAA SPC
The EF scale — Enhanced Fujita — rates tornado damage from EF0 (65-85 mph estimated winds) to EF5 (above 200 mph), using 28 damage indicators calibrated to specific structures. It is a post-event forensic tool, not a real-time measurement. The distinction matters: no anemometer has ever survived a violent tornado long enough to record its peak winds.
Derechos and Hail: The Underrated Threats
Supercells and tornadoes absorb most public attention on severe weather days, but derechos and large hail account for more aggregate property damage annually. A derecho is a line of convection — often a bow echo on radar — that maintains damaging straight-line winds of at least 58 mph across a path of 250 miles or more. The June 29, 2012 derecho tracked from Indiana to the mid-Atlantic in roughly 12 hours, left 4.2 million customers without power, and killed 22 people.
 NWS Northern Indiana (IWX) storm survey / NOAA
Hail forms when updrafts carry water droplets above the freezing level repeatedly. Each cycle adds a layer of ice. A hailstone 2 inches in diameter requires an updraft of approximately 100 mph to remain suspended long enough to reach that size. The largest confirmed hailstone in U.S. history fell in Vivian, South Dakota, on July 23, 2010: 8 inches in diameter, 1.93 pounds.
Field Notes
Check the SPC's Day 1 Convective Outlook at 0600 UTC and 1630 UTC — those are the two updates most likely to reflect morning soundings and afternoon model runs that shift risk areas significantly. If your location falls within a Slight Risk or greater and surface dewpoints are above 65°F by early afternoon, the atmosphere has the moisture component in place. A Marginal Risk with a mesoscale discussion already posted by the SPC warrants more attention than a Slight Risk with no associated discussion — the text tells you what the polygon cannot.