
This Week in Weather
Rearview of the past 7 days and the pattern shaping the week ahead.
Rearview
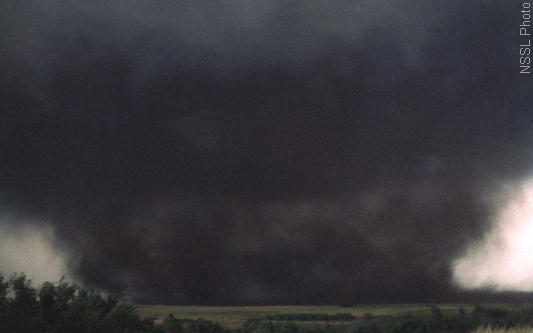
The week's signature number is 61 — confirmed tornadoes in seven days, concentrated in a corridor from Arkansas and Mississippi north through Missouri, Illinois, and Indiana. SPC storm reports logged 804 hail events and 679 wind reports across the period, with Missouri alone accounting for 460 combined reports, more than Texas (216) and Kansas (160) combined.
The most compressed violence came on the night of April 28–29. Between 01:56Z and 02:28Z on April 29, tornado warnings fired for DeSoto County, MS twice, Marshall County, MS, Drew County, AR, and a joint warning covering Ashley and Chicot Counties in Arkansas alongside Washington County, MS — five warnings in 32 minutes across three states, all issued by Memphis (MEG) and Little Rock (LZK). The next afternoon brought a second round: NWS Jackson issued a tornado warning for Clarke, Jasper, and Jones Counties in Mississippi at 19:59Z, and two minutes earlier NWS Pittsburgh fired one for Indiana County, Pennsylvania at 19:57Z — separate convective lines riding the same trough, the latter a reminder that the system's northern edge reached well into Appalachian terrain where tornado climatology is thinner and lead times shorter.
 NOAA NSSL archive
The week's 892 severe thunderstorm warnings and 173 tornado warnings represent a substantial activation of the warning system — roughly 1,100 convective warnings in addition to 65 flash flood warnings and 97 flood warnings, the latter concentrated in the same moisture-saturated corridor that fed the tornado events.
Away from the convective story: a M6.1 struck 18 km west of Sarabetsu, Japan on April 26 at 20:23Z, the week's largest seismic event globally. In Nevada, a M5.2 19 km southeast of Silver Springs added to the Basin and Range's background seismicity. Solar activity stayed quiet — Kp held at 0 — but the sun produced an M6.0 flare on April 26 at 22:57Z, the strongest X-ray event of the week. No significant geomagnetic effects followed.
Roadmap
The pattern for the week of April 30–May 7 is shaped by a progressive upper-level trough lifting out of the central U.S. and a rebuilding ridge along the West Coast. That configuration typically means the active severe weather axis shifts eastward and eventually loses organization as the trough flattens, while the interior West sees a brief unsettled window before high pressure reasserts. Moisture return from the Gulf remains the key variable for the South and Southeast.
 NOAA NESDIS
Northeast. New York City averages 66°F for the week with 1.10 inches of total precipitation. The highest probability window is May 6 at 72%, consistent with the trough's eastern progression delivering a meaningful rain event to the mid-Atlantic and southern New England late in the period. Not a drought-breaker, but a legitimate soaking for areas that have been running dry through April.
Southeast. Atlanta sits at a 78°F average high with 0.96 inches of accumulation. The peak probability — 75% on May 7 — lands at the tail end of the week, suggesting the Southeast gets the trough's trailing energy rather than its leading edge. That timing, combined with Gulf moisture that never fully evacuated after last week's outbreak, keeps the severe weather potential non-trivial through the May 6–7 window. The setup won't replicate last week's intensity, but isolated supercell potential exists if the cap erodes on schedule.
Mountain West. Denver's week looks mild on paper — 68°F average high — but the 96% precipitation probability on May 5 is the most confident signal in the dataset. A closed low dropping into the Four Corners region would explain that number. Snowfall above 8,000 feet is plausible; the Palmer Divide and Front Range foothills should watch May 4–5 closely. Total accumulation is modest at 0.39 inches liquid equivalent, but the probability spike suggests a well-organized system rather than scattered convective noise.
Midwest and South Plains. Chicago averages 62°F with only 0.57 inches and a 48% peak on May 4 — the trough passes quickly enough that the window stays limited. Dallas runs warmer at 84°F average high with 0.69 inches and a 29% peak on May 6, indicating the South Plains sits on the dry side of the week's main moisture axis for most of the period.
Pacific Coast and International. San Francisco stays near its seasonal norm at 64°F with just 0.18 inches — the rebuilding West Coast ridge keeps organized precipitation at bay. London's 64°F average high reflects the persistent maritime pattern that has characterized western Europe through spring 2026.
 NOAA CPC
Looking Ahead
The May 5 Denver precipitation window carries a 96% probability — the highest confidence signal in this week's outlook — and residents in the Colorado Front Range foothills should have a plan for potential late-season snowfall above 8,000 feet by Tuesday evening. The May 6–7 Southeast window deserves monitoring for isolated severe weather, particularly if Gulf moisture return outpaces the forecast; the same atmospheric ingredients that drove last week's outbreak have not been fully flushed from the region. The April 26 M6.0 solar flare produced no geomagnetic impact, but the sun is in an active phase — SWPC's real-time Kp and X-ray feeds are worth a check before any aurora-sensitive travel or HF radio operations this week.