Marine Weather: Eight feet of significant wave height
Eight feet of significant wave height doesn't sound like much until you're on a 32-foot vessel and understand that "significant" is already a statistical
Eight feet of significant wave height doesn't sound like much until you're on a 32-foot vessel and understand that "significant" is already a statistical average — specifically, the mean of the highest one-third of waves in a given sea state. The actual maximum in that sea is routinely 1.5 to 2 times that figure. At 421 AM AKDT on October 14, 2026, NWS Juneau's Marine Weather Message put a Storm Warning in effect from 4 AM to 10 AM AKDT on October 15 for the Cape Spencer to Cape Fairweather waters, with east winds of 35 to 45 knots, gusts to 55 knots, and seas of 19 to 24 feet. The office's Coastal Waters Forecast carried the same storm-warning headline for those waters — one warning, presented in two complementary products — and put commercial fishermen, ferry operators, and any small-craft traffic on notice that the Gulf of Alaska was not navigable by the usual standards. (NWS Juneau Marine Weather Message, issued 421 AM AKDT October 14, 2026 (IEM archive); NWS Juneau Coastal Waters Forecast, issued 349 AM AKDT October 14, 2026 (IEM archive))
That warning infrastructure is worth understanding precisely, because the tiered system it represents — Small Craft Advisory, Gale Warning, Storm Warning, Hurricane Force Wind Warning — isn't just bureaucratic gradation. Each threshold corresponds to a specific Beaufort range and expected sea state, and crossing from one to the next represents a nonlinear jump in vessel risk.
How Sea State Actually Works
Wave height is a function of three variables: wind speed, fetch (the unobstructed distance over which wind acts on the water surface), and duration. The North Pacific provides enormous fetch — thousands of kilometers of open ocean — which is why Southeast Alaska sees disproportionately severe sea states even from systems that would be unremarkable in a landlocked context. A 40-knot wind blowing over 500 nautical miles of open water for 24 hours generates a fundamentally different sea than the same wind over a 50-mile coastal fetch.
The complicating factor is swell. Wind waves and swell can arrive from different directions simultaneously, producing a cross-sea that is harder to navigate than a higher but more regular wave train. A vessel pitching into 8-foot head seas is working hard but predictably; a vessel in a combined sea of 5-foot wind waves crossing 4-foot swell at 60 degrees is dealing with something closer to controlled chaos. NWS marine forecasts distinguish between these components, and reading that distinction is a practiced skill.
 NOAA / Wikimedia
Rogue waves — conventionally defined as waves exceeding twice the significant wave height — remain the genuinely unsolved corner of this problem. Satellite altimetry and wave-buoy records have confirmed they occur far more frequently than classical linear wave theory predicts. The leading explanations involve nonlinear wave-wave interactions and, in some locations, current-wave interactions that focus energy spatially. The Draupner wave, measured on a North Sea platform on January 1, 1995, recorded 25.6 meters in a sea state where the significant wave height was roughly 12 meters — a ratio of about 2.1. It was the first instrumentally verified rogue wave. The oceanographic community is still building a reliable probabilistic model for their occurrence.
The Warning System as Infrastructure
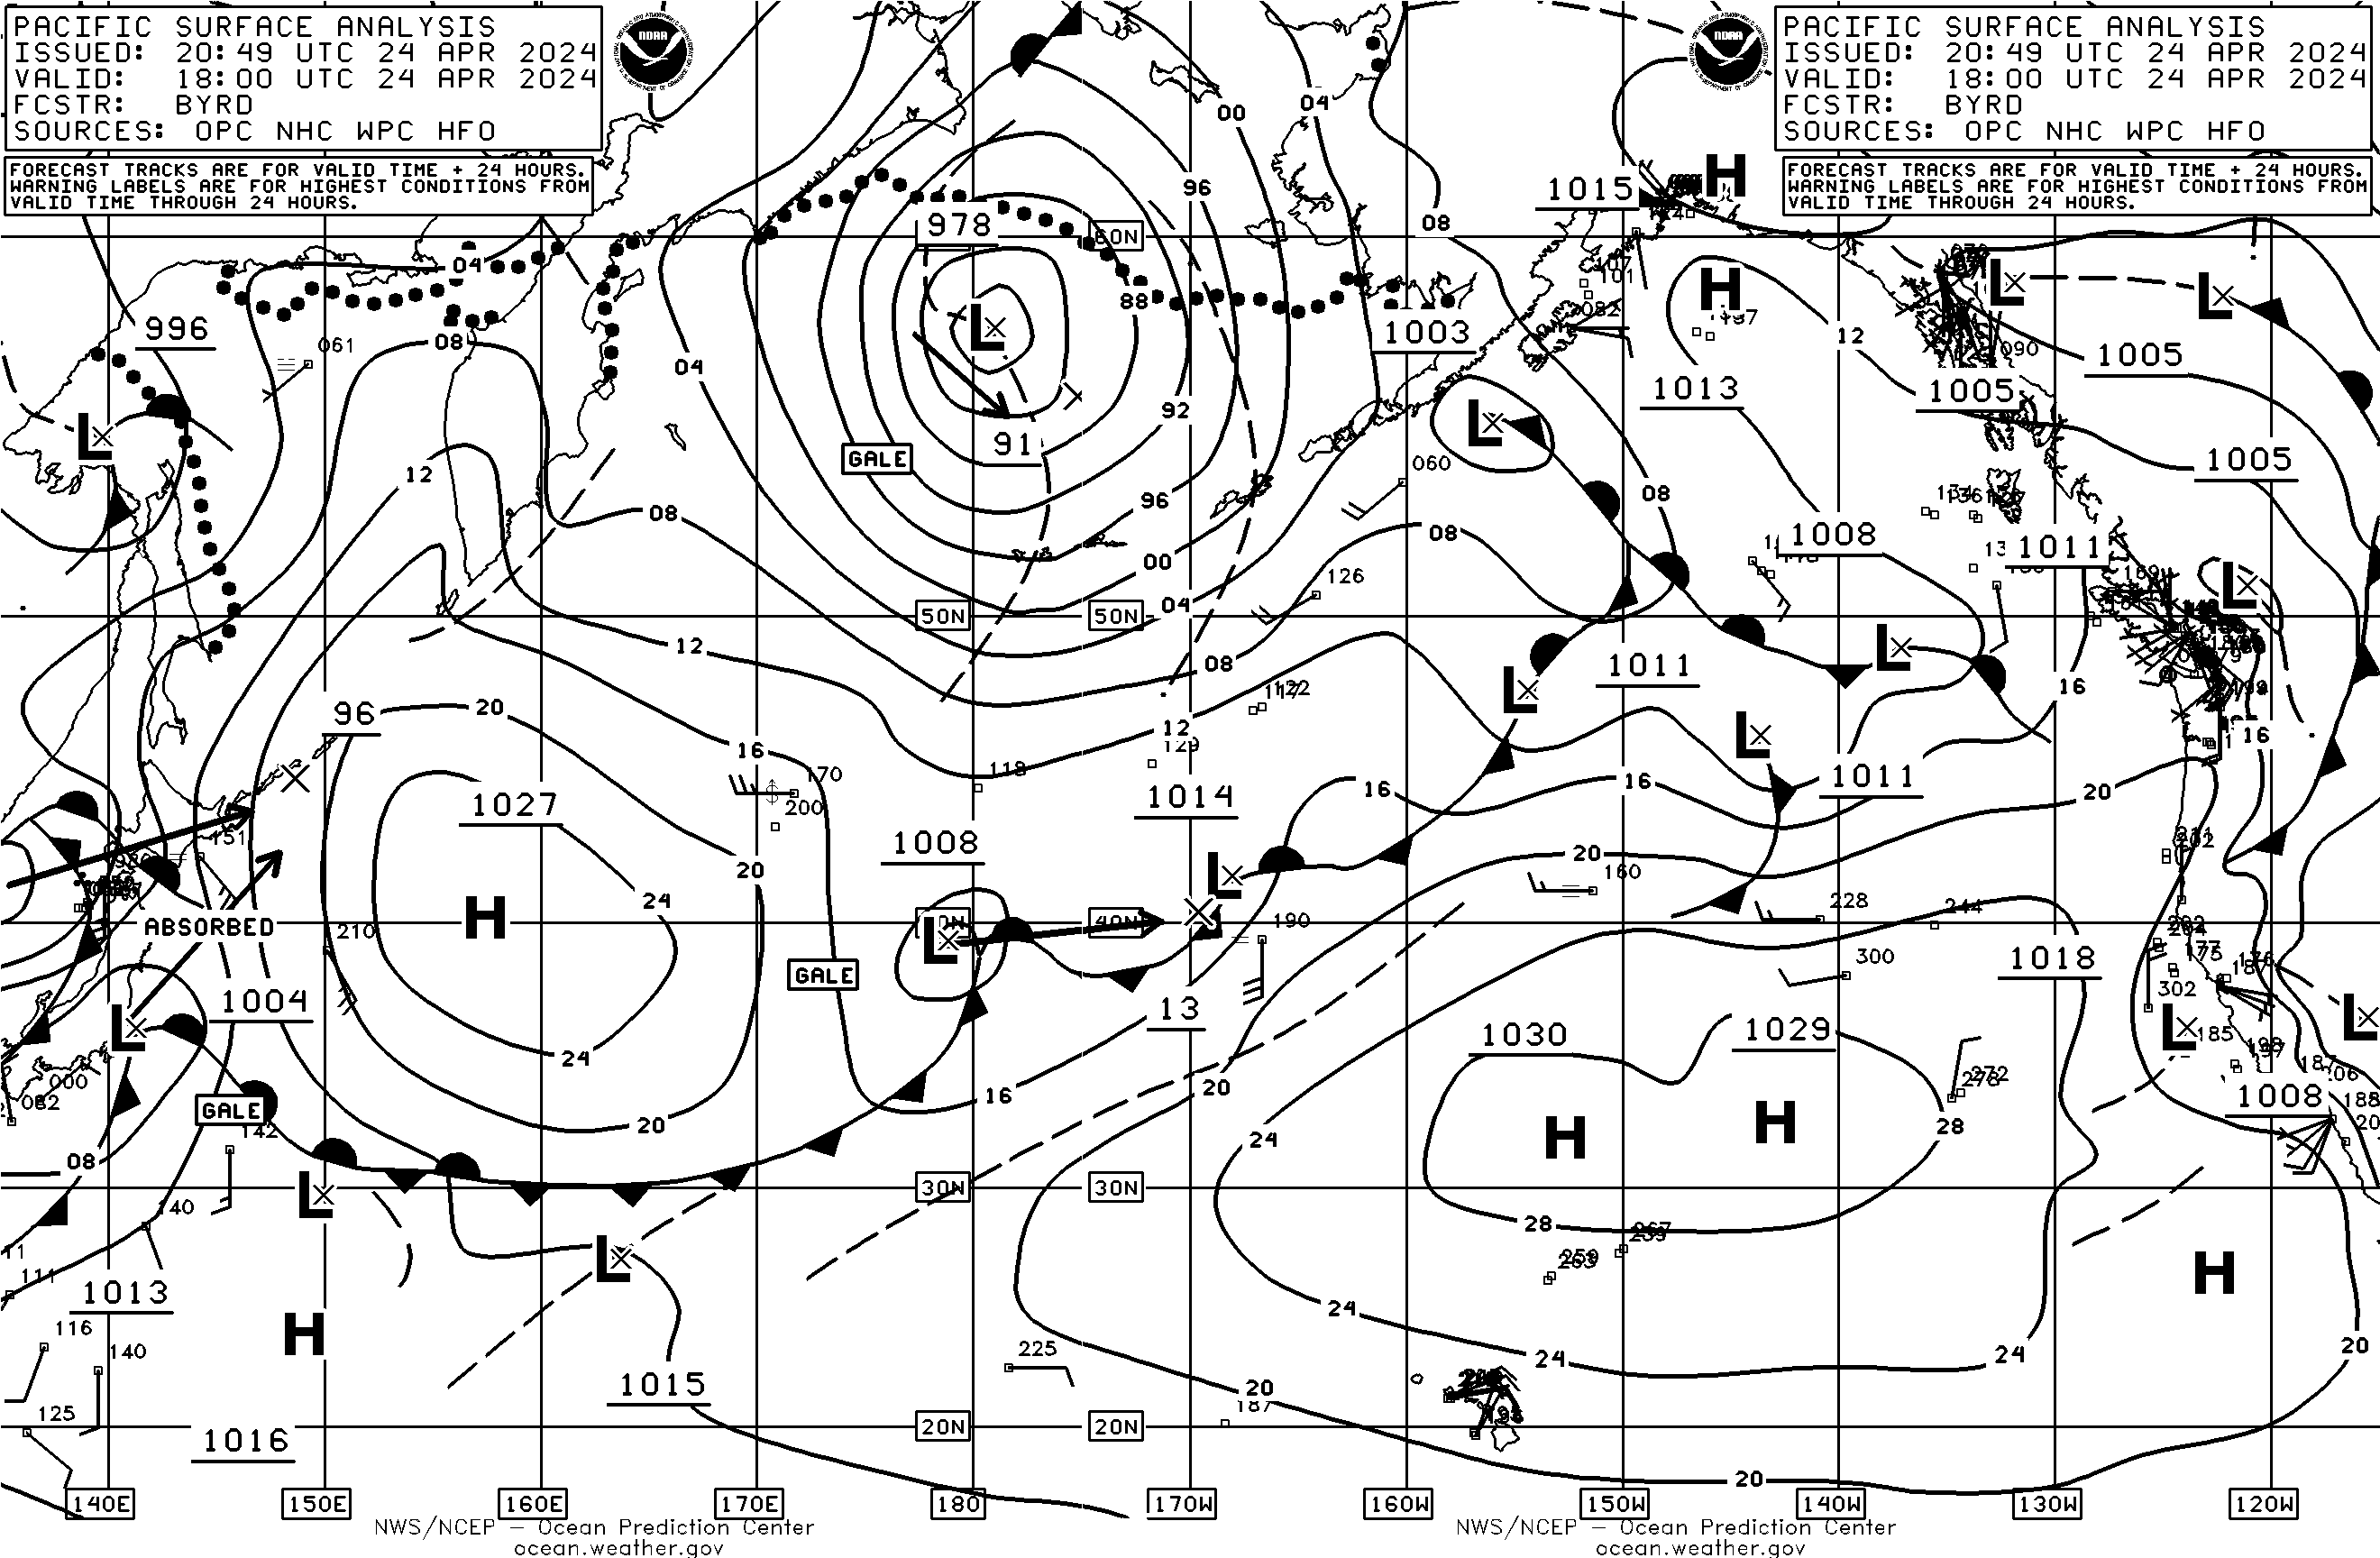
A Storm Warning from NWS Juneau isn't just a text product — it is the input that vessel operators, harbormasters, and ferry dispatchers plan around, because it carries explicit wind, sea, and timing thresholds rather than a general caution. The two products behind the October 14 citation do different jobs: the Marine Weather Message (MWW) is the warning product itself, carrying the watches, warnings, and advisories with their effective windows, while the Coastal Waters Forecast (CWF) is the zone-by-zone wind and seas forecast that can carry the same warning as a headline. Reading the warning in the MWW and the expected conditions in the CWF together is what turns a headline into a go/no-go decision.
NOAA OPC
The economic logic of heeding these warnings is straightforward for commercial operators, but the life-safety logic is what drives the NWS investment in marine forecasting. Alaska's commercial fishing industry has one of the highest occupational fatality rates in the United States, and a disproportionate share of those fatalities involve vessels that departed in deteriorating conditions or were caught by faster-than-forecast intensification. Lead time is the only commodity a forecast can actually provide.
For large commercial shipping, the same sea-state data feeds weather routing software that threads vessels between systems to minimize fuel consumption and structural stress. A well-routed transpacific crossing can reduce fuel burn by 5 to 10 percent compared to a great-circle route that ignores the forecast — on a Panamax bulk carrier, that's a six-figure difference per voyage. The forecast products that protect a 32-foot fishing vessel and the ones that optimize a 600-foot container ship are built from the same numerical models and the same buoy network.
Field Notes
Check the significant wave height and the swell direction separately in any NWS marine forecast — the combined sea state is what your vessel actually encounters, not either component alone.
If you're tracking a storm system near Southeast Alaska, read NWS Juneau's MWW for the warning itself and its CWF for the zone-by-zone wind and seas — the forecast can carry the same warning as a headline, so use the message for effective windows and the forecast for expected conditions.
Rogue wave probability increases in areas where strong ocean currents run counter to dominant wave direction — the Agulhas Current off South Africa is the canonical example, but the Gulf of Alaska's variable current field creates analogous conditions during major storm events.
 NOAA
NOAA
Source coverage
Reporting interval: 2026-10-11T16:04:56.921Z to 2026-10-14T16:04:56.921Z (end exclusive). Counts and peaks describe only the observations and intervals listed below. Missing data is unknown, never zero. Forecasts are point forecasts for the named cities.
- Curated educational topic outline: Marine Weather (not current observations): complete. Requested: 2026-10-11T16:04:56.921Z to 2026-10-14T16:04:56.921Z. Checked: 2026-10-14T16:04:56.921Z.
- Recent headline sample (up to 40; original stories require review): partial. Observations: 2026-10-14T07:43:00.000Z to 2026-10-14T15:59:00.000Z. Requested: 2026-10-11T16:04:56.921Z to 2026-10-14T16:04:56.921Z. Checked: 2026-10-14T16:04:57.961Z. Headline aggregation does not establish original-source coverage; review any current-event claims against linked originals.