This Week in Weather — November 1, 2026
Severe weather rearview, storm reports, and the forecast pattern for the week of November 1, 2026.
Rearview
The week's most concentrated severe weather landed on October 28, when a convective outbreak across Minnesota produced 15 of the 37 total preliminary storm reports in the dataset. Hail was the dominant hazard: a 3.00-inch hailstone was reported southwest of Grove City in Meeker County at 1:53 p.m. local time, the largest among available observations for the interval. Hail measuring 1.75 inches hit the Miesville area of Dakota County shortly after 5 p.m. local time, and a cluster of dime-to-quarter-size reports stretched from Yellow Medicine County northwest of the Twin Cities down through Kandiyohi and Benton counties through the afternoon. Tornado warnings from WFO MPX covered Dakota and Goodhue counties in Minnesota and Pierce County in Wisconsin; WFO DLH issued a separate warning for Pine County, Minnesota and Burnett County, Wisconsin. A preliminary report described a brief tornado near Danbury in Burnett County — weak rotation that lifted debris and water off Love Lake, with no damage reported at the time.
 NWS Aberdeen, SD / NOAA
Across the full reporting interval, IEM polygon data shows 190 warnings across the five tracked types (TO.W, SV.W, FF.W, MA.W, EW.W), with flash flood warnings (80) and severe thunderstorm warnings (68) accounting for the majority. Six tornado warnings were issued. Preliminary reports also described two brief tornadoes in New Mexico on the afternoon of October 25 — one near Table Mesa in San Juan County and one near McAlister in Quay County — both in open terrain with no damage reported. El Paso WFO issued two additional tornado warnings for Hudspeth and El Paso counties in far west Texas late on October 25 local time. A separate tornado warning from WFO EWX covered Kinney and Uvalde counties in Texas on the evening of October 29 local time.
Flash flooding was active at both ends of the week, with warnings in Louisiana (Evangeline and Rapides parishes), Bay County, Florida, and Yavapai County, Arizona all issued in the final hours before the reporting interval closed on November 1.
On the space weather side, the planetary Kp index reached 6.0 during the 6:00–9:00 p.m. UTC window on October 31 — a G2-class geomagnetic storm threshold — before easing back below 5 by early November 1. The most recent observed X-ray flux in the dataset was C2.9; that single sample does not summarize flare activity across the full interval. GOES primary flux coverage was 97% complete; the 312 missing one-minute samples are noted but do not affect the Kp peak, which comes from a separate instrument chain.
The week's single significant earthquake was a M6.4 at 10 km depth southeast of Easter Island on October 29 at 7:49 a.m. UTC. Among the 137 M4.5+ events in the catalog for the interval, this was the largest among available observations.
Roadmap
The WPC short-range discussion (issued 2:58 a.m. EST November 1, valid 12Z November 1 through 12Z November 3; source: https://www.wpc.ncep.noaa.gov/discussions/pmdspdbody.txt) describes a low pressure system originating off Baja California merging with a broad upper-level trough entering the West Coast. Through today, the primary hazard is flash flooding across the Southwest and Four Corners, where storm-total rainfall of 2–4 inches is possible on upslope terrain over already-saturated soils. By Monday, a deep surface cyclone is expected to consolidate rapidly over the central High Plains, bringing gusty winds, showers, and embedded thunderstorms to the Northern Plains and a severe weather threat to the Central and Southern Plains in the afternoon and evening hours local time. WPC notes a Winter Storm Warning and Winter Weather Advisories for portions of the Central Rockies, where heavy snow is expected on the system's back side. On the East Coast, a high-pressure system sliding offshore is funneling persistent onshore flow into the Florida Peninsula, sustaining a heavy rainfall and isolated flash flooding threat along the east coast of Florida through Monday. The same high keeps most of the eastern U.S. dry, with below-normal temperatures in New England and milder conditions to the south.
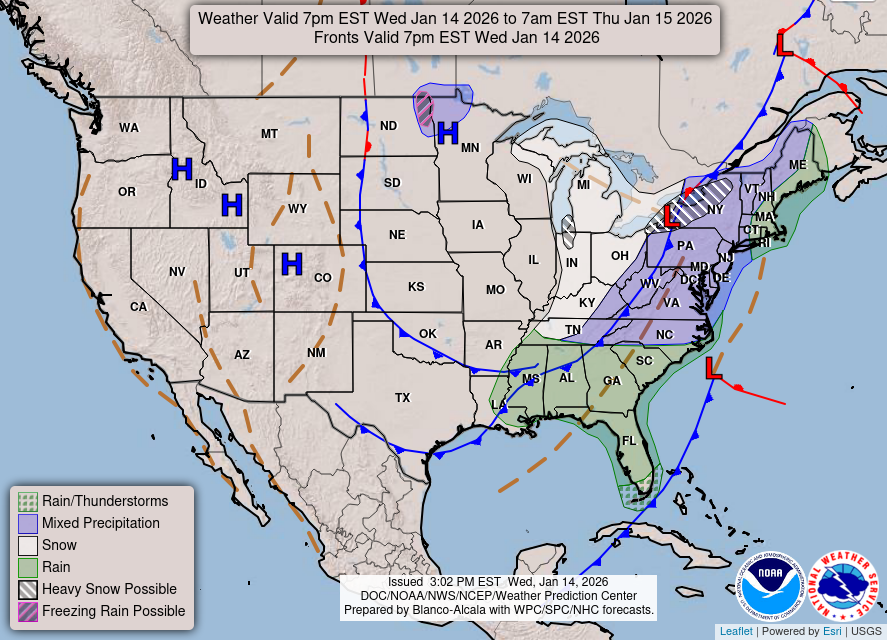 NOAA/NWS Weather Prediction Center
The WPC extended-range discussion (issued 1:28 a.m. EST November 1, valid 12Z November 4 through 12Z November 8; source: https://www.wpc.ncep.noaa.gov/discussions/pmdepdbody.txt) describes an amplified upper trough and associated frontal system advancing from the Mississippi Valley into the Ohio and Tennessee valleys by Wednesday, November 4, with a Marginal Risk for excessive rainfall across portions of those regions. The system tracks northeast into the Mid-Atlantic and Northeast by Thursday–Friday, with showers and thunderstorms developing ahead of the front. Timing and amplitude uncertainty remains meaningful — model spread on the northern/southern stream interaction is the primary forecast challenge for the mid-week period. Behind the front, cooler and drier conditions are expected to spread eastward. Across the West, a short-lived ridge builds over the Intermountain West mid-week before additional Pacific energy increases precipitation chances across the Pacific Northwest by late in the period.
City samples (Open-Meteo point forecasts; these describe individual grid points, not regional conditions):
- New York City — November 1: high 60°F, dry. A gradual warm-up carries highs to 68–71°F by November 6, when precipitation probability reaches 54% and drizzle is possible. November 7 shows 0.61 inches of rain at 47% probability.
- Atlanta — November 1: high 65°F with a 47% chance of drizzle. Conditions improve November 2–3 (highs near 73–74°F, mostly dry), then precipitation chances return November 4–5 (64% probability both days, up to 0.09 inches).
- Chicago — November 3 brings a 38% precipitation chance ahead of the main event: November 4 shows 0.49 inches at 73% probability, consistent with the WPC's mid-week frontal timing. Highs drop from 67°F on November 4 to 56°F by November 6.
- Denver — November 3 is the wet day: 0.19 inches at 57% probability, high 61°F. Drier conditions follow through the weekend, with highs in the low 60s.
- Dallas — November 3 stands out: 1.46 inches at 90% probability, high 77°F. The surrounding days are largely dry and warm (83°F on November 2).
- San Francisco — November 1 and 3 both show precipitation chances (50% and 78% respectively), but totals are modest (under 0.06 inches). November 4 still carries a 78% precipitation probability despite no modeled accumulation at this point. November 5–7 are mostly dry in the point forecast, with highs reaching 74°F.
Alaska, Hawaii, and WPC discussions covering those regions are not available in this dataset.
What to Watch
- If you are in the Central or Southern Plains on Monday, the WPC short-range discussion specifically flags a severe weather threat for that afternoon and evening — check your local NWS office for watch and warning updates as the deepening cyclone organizes.
- The November 4–5 heavy rainfall window for the Ohio and Tennessee valleys carries meaningful model uncertainty; if you have travel or outdoor commitments in that corridor mid-week, treat the forecast as more volatile than the probability numbers alone suggest.
- The observed October 31 Kp-6 peak met the G2 geomagnetic storm threshold. The Kp index alone does not establish whether disruption occurred; SWPC's three-day forecast is useful if you operate HF radio, GPS-dependent equipment, or power infrastructure sensitive to geomagnetically induced currents.
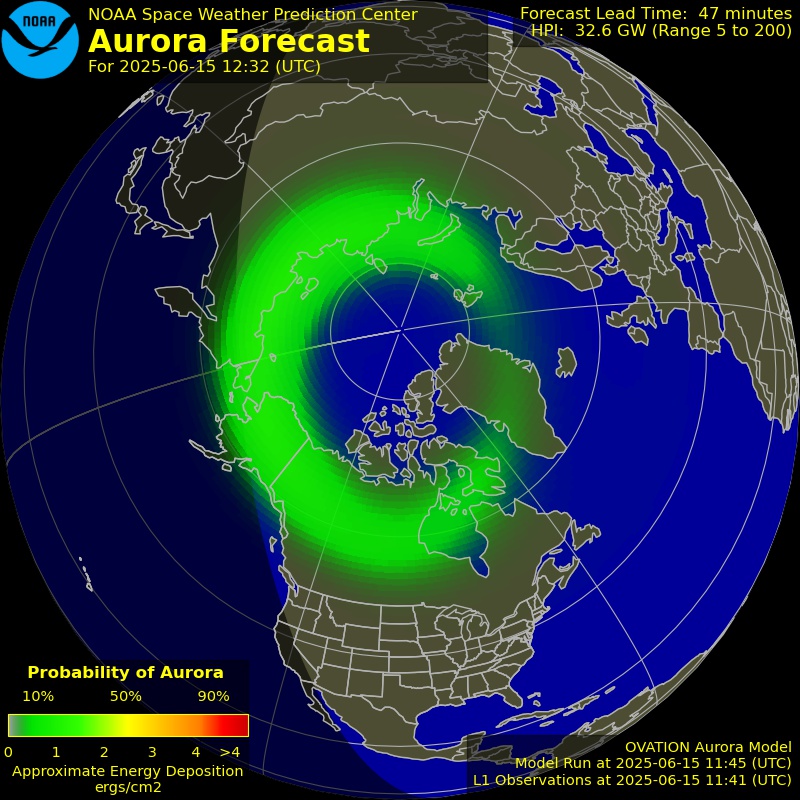 NOAA SWPC
Some source data was incomplete. The article names the known gap; open the source details for the full record.
Source coverage and data limitations
Reporting interval: 2026-10-25T12:00:00.000Z to 2026-11-01T12:00:00.000Z (end exclusive). Counts and peaks describe only the observations and intervals listed below. Missing data is unknown, never zero. City forecasts are point forecasts; Lower 48 pattern statements, when present, use the dated NOAA/WPC discussions.
- IEM polygon warnings issued (TO/SV/FF/MA/EW.W only): complete. 1/1 archive queries (unique warning events). Observations: 2026-10-25T21:26:00.000Z to 2026-11-01T11:53:00.000Z. Requested: 2026-10-25T12:00:00.000Z to 2026-11-01T12:00:00.000Z. Checked: 2026-11-01T17:07:19.276Z.
- SPC preliminary reports 2026-10-25: complete. 1/1 complete report days. Observations: 2026-10-25T20:24:00.000Z to 2026-10-26T01:20:00.000Z. Requested: 2026-10-25T12:00:00.000Z to 2026-10-26T12:00:00.000Z. Checked: 2026-11-01T17:07:19.409Z.
- SPC preliminary reports 2026-10-26: complete. 1/1 complete report days. Requested: 2026-10-26T12:00:00.000Z to 2026-10-27T12:00:00.000Z. Checked: 2026-11-01T17:07:19.617Z.
- SPC preliminary reports 2026-10-27: complete. 1/1 complete report days. Observations: 2026-10-28T00:55:00.000Z to 2026-10-28T00:55:00.000Z. Requested: 2026-10-27T12:00:00.000Z to 2026-10-28T12:00:00.000Z. Checked: 2026-11-01T17:07:19.717Z.
- SPC preliminary reports 2026-10-28: complete. 1/1 complete report days. Observations: 2026-10-28T17:36:00.000Z to 2026-10-28T23:48:00.000Z. Requested: 2026-10-28T12:00:00.000Z to 2026-10-29T12:00:00.000Z. Checked: 2026-11-01T17:07:19.818Z.
- SPC preliminary reports 2026-10-29: complete. 1/1 complete report days. Observations: 2026-10-29T21:16:00.000Z to 2026-10-30T03:01:00.000Z. Requested: 2026-10-29T12:00:00.000Z to 2026-10-30T12:00:00.000Z. Checked: 2026-11-01T17:07:20.131Z.
- SPC preliminary reports 2026-10-30: complete. 1/1 complete report days. Observations: 2026-10-30T18:45:00.000Z to 2026-10-31T01:05:00.000Z. Requested: 2026-10-30T12:00:00.000Z to 2026-10-31T12:00:00.000Z. Checked: 2026-11-01T17:07:20.338Z.
- SPC preliminary reports 2026-10-31: complete. 1/1 complete report days. Requested: 2026-10-31T12:00:00.000Z to 2026-11-01T12:00:00.000Z. Checked: 2026-11-01T17:07:20.778Z.
- NOAA SWPC planetary Kp: complete. 56/56 three-hour blocks. Observations: 2026-10-25T12:00:00.000Z to 2026-11-01T09:00:00.000Z. Requested: 2026-10-25T12:00:00.000Z to 2026-11-01T12:00:00.000Z. Checked: 2026-11-01T17:07:19.184Z.
- NOAA GOES primary 0.1–0.8 nm X-ray flux: partial. 9768/10080 one-minute samples. Observations: 2026-10-25T17:07:00.000Z to 2026-11-01T11:59:00.000Z. Requested: 2026-10-25T12:00:00.000Z to 2026-11-01T12:00:00.000Z. Checked: 2026-11-01T17:07:19.203Z. Missing 312 of 10080 expected intervals; peak is only for observed coverage.
- USGS significant (significance > 600) earthquakes: complete. 1/1 catalog queries. Observations: 2026-10-29T07:49:50.928Z to 2026-10-29T07:49:50.928Z. Requested: 2026-10-25T12:00:00.000Z to 2026-11-01T12:00:00.000Z. Checked: 2026-11-01T17:07:19.632Z.
- USGS M4.5+ earthquakes: complete. 1/1 catalog queries. Observations: 2026-10-25T12:09:05.522Z to 2026-11-01T11:56:51.778Z. Requested: 2026-10-25T12:00:00.000Z to 2026-11-01T12:00:00.000Z. Checked: 2026-11-01T17:07:19.389Z.
- Open-Meteo point forecast: Northeast (NYC area): complete. 7/7 UTC forecast days. Observations: 2026-11-01T00:00:00.000Z to 2026-11-07T00:00:00.000Z. Requested: 2026-11-01T00:00:00.000Z to 2026-11-08T00:00:00.000Z. Checked: 2026-11-01T17:07:19.774Z.
- Open-Meteo point forecast: Southeast (Atlanta area): complete. 7/7 UTC forecast days. Observations: 2026-11-01T00:00:00.000Z to 2026-11-07T00:00:00.000Z. Requested: 2026-11-01T00:00:00.000Z to 2026-11-08T00:00:00.000Z. Checked: 2026-11-01T17:07:19.785Z.
- Open-Meteo point forecast: Midwest (Chicago area): complete. 7/7 UTC forecast days. Observations: 2026-11-01T00:00:00.000Z to 2026-11-07T00:00:00.000Z. Requested: 2026-11-01T00:00:00.000Z to 2026-11-08T00:00:00.000Z. Checked: 2026-11-01T17:07:19.453Z.
- Open-Meteo point forecast: Mountain West (Denver area): complete. 7/7 UTC forecast days. Observations: 2026-11-01T00:00:00.000Z to 2026-11-07T00:00:00.000Z. Requested: 2026-11-01T00:00:00.000Z to 2026-11-08T00:00:00.000Z. Checked: 2026-11-01T17:07:19.459Z.
- Open-Meteo point forecast: Pacific (San Francisco area): complete. 7/7 UTC forecast days. Observations: 2026-11-01T00:00:00.000Z to 2026-11-07T00:00:00.000Z. Requested: 2026-11-01T00:00:00.000Z to 2026-11-08T00:00:00.000Z. Checked: 2026-11-01T17:07:19.917Z.
- Open-Meteo point forecast: South Plains (Dallas area): complete. 7/7 UTC forecast days. Observations: 2026-11-01T00:00:00.000Z to 2026-11-07T00:00:00.000Z. Requested: 2026-11-01T00:00:00.000Z to 2026-11-08T00:00:00.000Z. Checked: 2026-11-01T17:07:19.556Z.
- Open-Meteo point forecast: London: complete. 7/7 UTC forecast days. Observations: 2026-11-01T00:00:00.000Z to 2026-11-07T00:00:00.000Z. Requested: 2026-11-01T00:00:00.000Z to 2026-11-08T00:00:00.000Z. Checked: 2026-11-01T17:07:19.920Z.
- Open-Meteo point forecast: Tokyo: complete. 7/7 UTC forecast days. Observations: 2026-11-01T00:00:00.000Z to 2026-11-07T00:00:00.000Z. Requested: 2026-11-01T00:00:00.000Z to 2026-11-08T00:00:00.000Z. Checked: 2026-11-01T17:07:19.557Z.
- Open-Meteo point forecast: Sydney: complete. 7/7 UTC forecast days. Observations: 2026-11-01T00:00:00.000Z to 2026-11-07T00:00:00.000Z. Requested: 2026-11-01T00:00:00.000Z to 2026-11-08T00:00:00.000Z. Checked: 2026-11-01T17:07:19.560Z.
- NOAA/WPC Short Range Forecast Discussion: complete. 1/1 forecast discussion. Observations: 2026-11-01T07:58:00.000Z to 2026-11-01T07:58:00.000Z. Requested: 2026-11-01T17:07:18.832Z to 2026-11-03T05:07:18.832Z. Checked: 2026-11-01T17:07:19.534Z.
- NOAA/WPC Extended Forecast Discussion: complete. 1/1 forecast discussion. Observations: 2026-11-01T06:28:00.000Z to 2026-11-01T06:28:00.000Z. Requested: 2026-11-04T17:07:18.832Z to 2026-11-07T17:07:18.832Z. Checked: 2026-11-01T17:07:19.561Z.