This Week in Weather — November 8, 2026
Severe weather rearview, storm reports, and the forecast pattern for the week of November 8, 2026.
Rearview
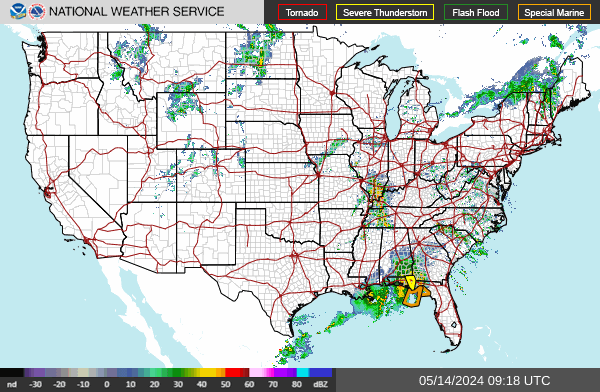
The week's most concentrated severe weather signature came from two separate convective rounds that moved through the south-central U.S. and the Carolinas between November 2 and November 6. Across the full seven-day interval ending November 8, the IEM polygon archive recorded 244 warnings in the five tracked categories — 81 severe thunderstorm, 78 flash flood, 62 marine, and 23 tornado warnings — covering observations from November 1 through November 8.
The first round developed overnight into November 2 and November 3 (local time). SPC preliminary reports logged four tornado events during this period, with touchdowns confirmed near Talala and Adair in Rogers and Mayes counties, Oklahoma, and near Cedarville in Crawford County, Arkansas. The Talala tornado produced a detectable debris signature on the KINX WSR-88D. A separate tornado near Keyes in Cimarron County, Oklahoma — the westernmost point in the Oklahoma panhandle — carved a narrow southwest-to-northeast path through town, confirmed in a late-filing SPC report attributed to the Amarillo forecast office. Wind reports dominated the November 1–2 SPC log, with gusts reaching 66 mph near Northern Meadows in Sandoval County, New Mexico, and 64 mph north of Dumas in Moore County, Texas. Las Vegas's KLAS airport recorded a 52-knot peak gust during convective showers on the evening of November 1 local time.
 NOAA/NWS
The second and more geographically focused round struck the North Carolina coastal plain on the afternoon and evening of November 6 local time. Four tornado warnings were issued in rapid succession by WFOs Wilmington (ILM) and Raleigh (RAH), beginning at 1:00 p.m. local time in Bladen County and progressing northeast through Sampson and Wayne counties over roughly 90 minutes. The tight clustering of those four warnings across adjacent coastal-plain counties is consistent with a single organized convective system tracking northeast.
November 4 and November 5 produced no SPC preliminary reports in the validated data. The November 3 SPC log recorded six preliminary reports with listed report times spanning 16:10–19:08 UTC (10:10 a.m.–1:08 p.m. CST).
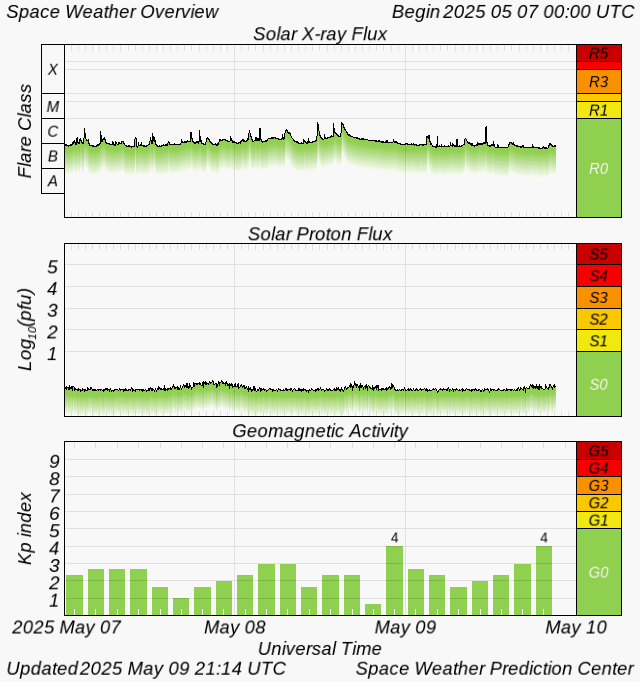
On the space weather side, planetary Kp reached 5.33 during the 18:00–21:00 UTC window on November 7 — a G1-class geomagnetic storm threshold — and a second interval at Kp 5.0 followed during the 00:00–03:00 UTC window on November 8. An M3.6 solar flare was recorded by GOES primary X-ray instrumentation at 18:33 UTC on November 5. GOES coverage was partial (9,735 of 10,080 expected one-minute samples), so the M3.6 designation applies to observed intervals only. No X-ray data from the 345 missing minutes is available.
 NOAA SWPC
The USGS M4.5-or-greater catalog logged 88 events in the reporting window. The largest among available observations was a M6.1 at 29 km depth, centered 144 km southeast of Hasaki, Japan, at 10:39 UTC on November 6; no tsunami was generated. No earthquakes met the USGS significance threshold of 600 during this interval.
Roadmap
WPC Short Range Discussion — issued 03:00 EST November 8, 2026; valid 12Z November 8 through 12Z November 10, 2026. Source: https://www.wpc.ncep.noaa.gov/discussions/pmdspdbody.txt
WPC Extended Range Discussion — issued 02:51 EST November 8, 2026; valid 12Z November 11 through 12Z November 15, 2026. Source: https://www.wpc.ncep.noaa.gov/discussions/pmdepdbody.txt
WPC does not issue CONUS discussions covering Alaska or Hawaii. No data for those regions is available.
Lower 48 pattern, November 8–10: A compact upper-level low is pushing Gulf moisture into southern Texas, where WPC has flagged a Slight Risk of Excessive Rainfall (level 2 of 4) for today through tonight, with flash flooding possible where multi-inch totals accumulate. The rest of the country sits under a broad high-pressure dome, with temperatures running 5–15°F above average across much of the northern tier and southern Plains. The main exceptions: a clipper system is cycling showers through the Great Lakes and interior New England today, and a pair of Pacific cyclones is delivering rounds of moderate rain and high-elevation snow to the Pacific Northwest, with the second system arriving Monday into Monday night. Gusty downslope winds are expected across northern Montana today. Most areas from the Rockies east to the Appalachians see dry conditions through Monday.
Lower 48 pattern, November 11–15: The WPC extended discussion describes a more amplified upper-level pattern developing through the second half of the week. A ridge building from the southern Plains into central Canada will keep the central and northern Plains well above normal — highs potentially 10–20°F above mid-November averages. The eastern U.S. tells a different story: an amplifying trough over the Great Lakes and Midwest is expected to spawn a surface low near the Mid-Atlantic by Thursday, with the system potentially tracking offshore as a nor'easter by Friday. WPC notes increasing precipitation prospects east of the Appalachians, with early-season snow possible across interior portions of the Northeast and into Pennsylvania. Uncertainty in track and intensity remains. The Pacific Northwest faces multiple rounds of rainfall from a developing northeast Pacific trough, with a more organized system potentially reaching northern California by the weekend. The CMC model is tracking a weaker solution for the East Coast storm than the GFS and ECMWF; WPC's blend leans toward the stronger guidance but ensemble means were increased to 40–50% weight by next Sunday to account for spread.
City point forecasts (Open-Meteo; dates are UTC forecast days; these are point samples, not regional conditions):
New York City area — Sunday through Wednesday dry, highs 55–62°F. Rain is forecast Thursday into Friday (November 12–13), with precipitation probability reaching 74% on the 13th and totals potentially exceeding 1 inch that day alone. A cold exit by November 14, high near 51°F.
Atlanta area — Dry and mild through mid-week, highs near 73°F. A notable temperature drop by November 13–14, with highs falling to 53°F and 51°F respectively, consistent with the WPC-described trough passage.
Chicago area — Dry through November 10, then a wet and cooling stretch. November 11–13 shows precipitation probabilities of 48–65%, with snow showers possible November 12–13 (WMO weather codes 85) as highs drop to 48°F and 42°F.
Denver area — Dry through the full forecast window, highs in the mid-60s to low 70s. No precipitation signal through November 14.
San Francisco area — Fog likely November 9–10, otherwise dry and mild, highs in the low 70s. Precipitation probability stays below 20% through November 14.
Dallas area — Mild to warm through mid-week, with a high of 80°F forecast for November 11. A sharp drop follows: high of 65°F on November 13, consistent with frontal passage.
The week's convective story was concentrated in time and space — two fast-moving episodes, one across the south-central U.S. and one along the North Carolina coastal plain — against an otherwise quiet severe-weather backdrop. The pattern ahead amplifies that contrast: a warm, ridge-dominated center of the country through mid-week, then a potentially significant East Coast storm system by Thursday and Friday whose track and intensity are still being negotiated between the major models. The next 48 hours of model runs will matter.
 NOAA NESDIS / STAR
Some source data was incomplete. The article names the known gap; open the source details for the full record.
Source coverage and data limitations
Reporting interval: 2026-11-01T12:00:00.000Z to 2026-11-08T12:00:00.000Z (end exclusive). Counts and peaks describe only the observations and intervals listed below. Missing data is unknown, never zero. City forecasts are point forecasts; Lower 48 pattern statements, when present, use the dated NOAA/WPC discussions.
- IEM polygon warnings issued (TO/SV/FF/MA/EW.W only): complete. 1/1 archive queries (unique warning events). Observations: 2026-11-01T12:34:00.000Z to 2026-11-08T11:04:00.000Z. Requested: 2026-11-01T12:00:00.000Z to 2026-11-08T12:00:00.000Z. Checked: 2026-11-08T17:40:35.892Z.
- SPC preliminary reports 2026-11-01: complete. 1/1 complete report days. Observations: 2026-11-01T21:50:00.000Z to 2026-11-02T06:10:00.000Z. Requested: 2026-11-01T12:00:00.000Z to 2026-11-02T12:00:00.000Z. Checked: 2026-11-08T17:40:35.792Z.
- SPC preliminary reports 2026-11-02: complete. 1/1 complete report days. Observations: 2026-11-02T19:11:00.000Z to 2026-11-03T08:36:00.000Z. Requested: 2026-11-02T12:00:00.000Z to 2026-11-03T12:00:00.000Z. Checked: 2026-11-08T17:40:36.372Z.
- SPC preliminary reports 2026-11-03: complete. 1/1 complete report days. Observations: 2026-11-03T16:10:00.000Z to 2026-11-03T19:08:00.000Z. Requested: 2026-11-03T12:00:00.000Z to 2026-11-04T12:00:00.000Z. Checked: 2026-11-08T17:40:36.454Z.
- SPC preliminary reports 2026-11-04: complete. 1/1 complete report days. Requested: 2026-11-04T12:00:00.000Z to 2026-11-05T12:00:00.000Z. Checked: 2026-11-08T17:40:36.599Z.
- SPC preliminary reports 2026-11-05: complete. 1/1 complete report days. Requested: 2026-11-05T12:00:00.000Z to 2026-11-06T12:00:00.000Z. Checked: 2026-11-08T17:40:36.674Z.
- SPC preliminary reports 2026-11-06: complete. 1/1 complete report days. Requested: 2026-11-06T12:00:00.000Z to 2026-11-07T12:00:00.000Z. Checked: 2026-11-08T17:40:36.776Z.
- SPC preliminary reports 2026-11-07: complete. 1/1 complete report days. Requested: 2026-11-07T12:00:00.000Z to 2026-11-08T12:00:00.000Z. Checked: 2026-11-08T17:40:36.882Z.
- NOAA SWPC planetary Kp: complete. 56/56 three-hour blocks. Observations: 2026-11-01T12:00:00.000Z to 2026-11-08T09:00:00.000Z. Requested: 2026-11-01T12:00:00.000Z to 2026-11-08T12:00:00.000Z. Checked: 2026-11-08T17:40:35.780Z.
- NOAA GOES primary 0.1–0.8 nm X-ray flux: partial. 9735/10080 one-minute samples. Observations: 2026-11-01T17:40:00.000Z to 2026-11-08T11:59:00.000Z. Requested: 2026-11-01T12:00:00.000Z to 2026-11-08T12:00:00.000Z. Checked: 2026-11-08T17:40:35.778Z. Missing 345 of 10080 expected intervals; peak is only for observed coverage.
- USGS significant (significance > 600) earthquakes: complete. 1/1 catalog queries. Requested: 2026-11-01T12:00:00.000Z to 2026-11-08T12:00:00.000Z. Checked: 2026-11-08T17:40:36.182Z.
- USGS M4.5+ earthquakes: complete. 1/1 catalog queries. Observations: 2026-11-01T12:08:30.561Z to 2026-11-08T11:58:32.451Z. Requested: 2026-11-01T12:00:00.000Z to 2026-11-08T12:00:00.000Z. Checked: 2026-11-08T17:40:36.149Z.
- Open-Meteo point forecast: Northeast (NYC area): complete. 7/7 UTC forecast days. Observations: 2026-11-08T00:00:00.000Z to 2026-11-14T00:00:00.000Z. Requested: 2026-11-08T00:00:00.000Z to 2026-11-15T00:00:00.000Z. Checked: 2026-11-08T17:40:36.091Z.
- Open-Meteo point forecast: Southeast (Atlanta area): complete. 7/7 UTC forecast days. Observations: 2026-11-08T00:00:00.000Z to 2026-11-14T00:00:00.000Z. Requested: 2026-11-08T00:00:00.000Z to 2026-11-15T00:00:00.000Z. Checked: 2026-11-08T17:40:36.095Z.
- Open-Meteo point forecast: Midwest (Chicago area): complete. 7/7 UTC forecast days. Observations: 2026-11-08T00:00:00.000Z to 2026-11-14T00:00:00.000Z. Requested: 2026-11-08T00:00:00.000Z to 2026-11-15T00:00:00.000Z. Checked: 2026-11-08T17:40:36.458Z.
- Open-Meteo point forecast: Mountain West (Denver area): complete. 7/7 UTC forecast days. Observations: 2026-11-08T00:00:00.000Z to 2026-11-14T00:00:00.000Z. Requested: 2026-11-08T00:00:00.000Z to 2026-11-15T00:00:00.000Z. Checked: 2026-11-08T17:40:36.479Z.
- Open-Meteo point forecast: Pacific (San Francisco area): complete. 7/7 UTC forecast days. Observations: 2026-11-08T00:00:00.000Z to 2026-11-14T00:00:00.000Z. Requested: 2026-11-08T00:00:00.000Z to 2026-11-15T00:00:00.000Z. Checked: 2026-11-08T17:40:36.205Z.
- Open-Meteo point forecast: South Plains (Dallas area): complete. 7/7 UTC forecast days. Observations: 2026-11-08T00:00:00.000Z to 2026-11-14T00:00:00.000Z. Requested: 2026-11-08T00:00:00.000Z to 2026-11-15T00:00:00.000Z. Checked: 2026-11-08T17:40:36.580Z.
- Open-Meteo point forecast: London: complete. 7/7 UTC forecast days. Observations: 2026-11-08T00:00:00.000Z to 2026-11-14T00:00:00.000Z. Requested: 2026-11-08T00:00:00.000Z to 2026-11-15T00:00:00.000Z. Checked: 2026-11-08T17:40:36.591Z.
- Open-Meteo point forecast: Tokyo: complete. 7/7 UTC forecast days. Observations: 2026-11-08T00:00:00.000Z to 2026-11-14T00:00:00.000Z. Requested: 2026-11-08T00:00:00.000Z to 2026-11-15T00:00:00.000Z. Checked: 2026-11-08T17:40:36.597Z.
- Open-Meteo point forecast: Sydney: complete. 7/7 UTC forecast days. Observations: 2026-11-08T00:00:00.000Z to 2026-11-14T00:00:00.000Z. Requested: 2026-11-08T00:00:00.000Z to 2026-11-15T00:00:00.000Z. Checked: 2026-11-08T17:40:36.627Z.
- NOAA/WPC Short Range Forecast Discussion: complete. 1/1 forecast discussion. Observations: 2026-11-08T08:00:00.000Z to 2026-11-08T08:00:00.000Z. Requested: 2026-11-08T17:40:35.556Z to 2026-11-10T05:40:35.556Z. Checked: 2026-11-08T17:40:36.289Z.
- NOAA/WPC Extended Forecast Discussion: complete. 1/1 forecast discussion. Observations: 2026-11-08T07:51:00.000Z to 2026-11-08T07:51:00.000Z. Requested: 2026-11-11T17:40:35.556Z to 2026-11-14T17:40:35.556Z. Checked: 2026-11-08T17:40:36.348Z.